top of page


Viz of the Month: September 2025
This heatmap by Kristen Savage shows environmental exposures reported at study enrollment by participants' socioeconomic status.
Sep 91 min read


Viz of the Month: August 2025
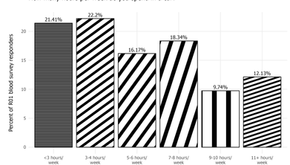
This bar chart by Emma Spielfogel shows the weekly duration (in hours) that participants reported spending in the car.
Aug 131 min read


Viz of the Month: July 2025
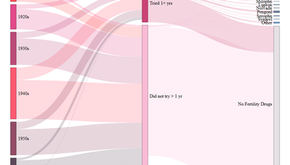
This Sankey chart by Kristen Savage highlights the connections between birth cohort, whether participants ever tried for a year to become pregnancy and could not, and fertility drugs used.
Jul 101 min read


Viz of the Month: June 2025
This pyramid plot by Emma Spielfogel compares participant age at Questionnaire (Q6) between questionnaire responders and non-responders.
Jun 101 min read


Viz of the Month: May 2025
This bar chart by Kristen Savage shows how self-reported handedness varied by decade of birth in the California Teachers Study.
May 91 min read


Viz of the Month: April 2024
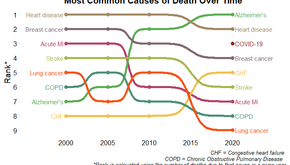
This bump chart by Kristen Savage visualizes changes in the most common causes of death over time.
Apr 181 min read
bottom of page